Understanding the Demographics Behind Redlining
12.17.2021
—
LISC StoriesLISC Jacksonville Newsletter
Introduction
As we discussed in our first article in October, LISC Jacksonville has taken the lead locally on conducting a deep-dive of “redlining” and the devastating effects that this Great Depression-era practice had on communities of color, both then and now. The focus of our work is to recognize the role that both public and private policy played in perpetuating race-based inequality, and how we can begin to reverse the impacts that redlining has had on our city’s most under-resourced and under-invested neighborhoods for generations.
To understand these impacts more thoroughly, we must investigate the demographics involved with redlining, including racial and economic profiles, which we will address in this article.
Race
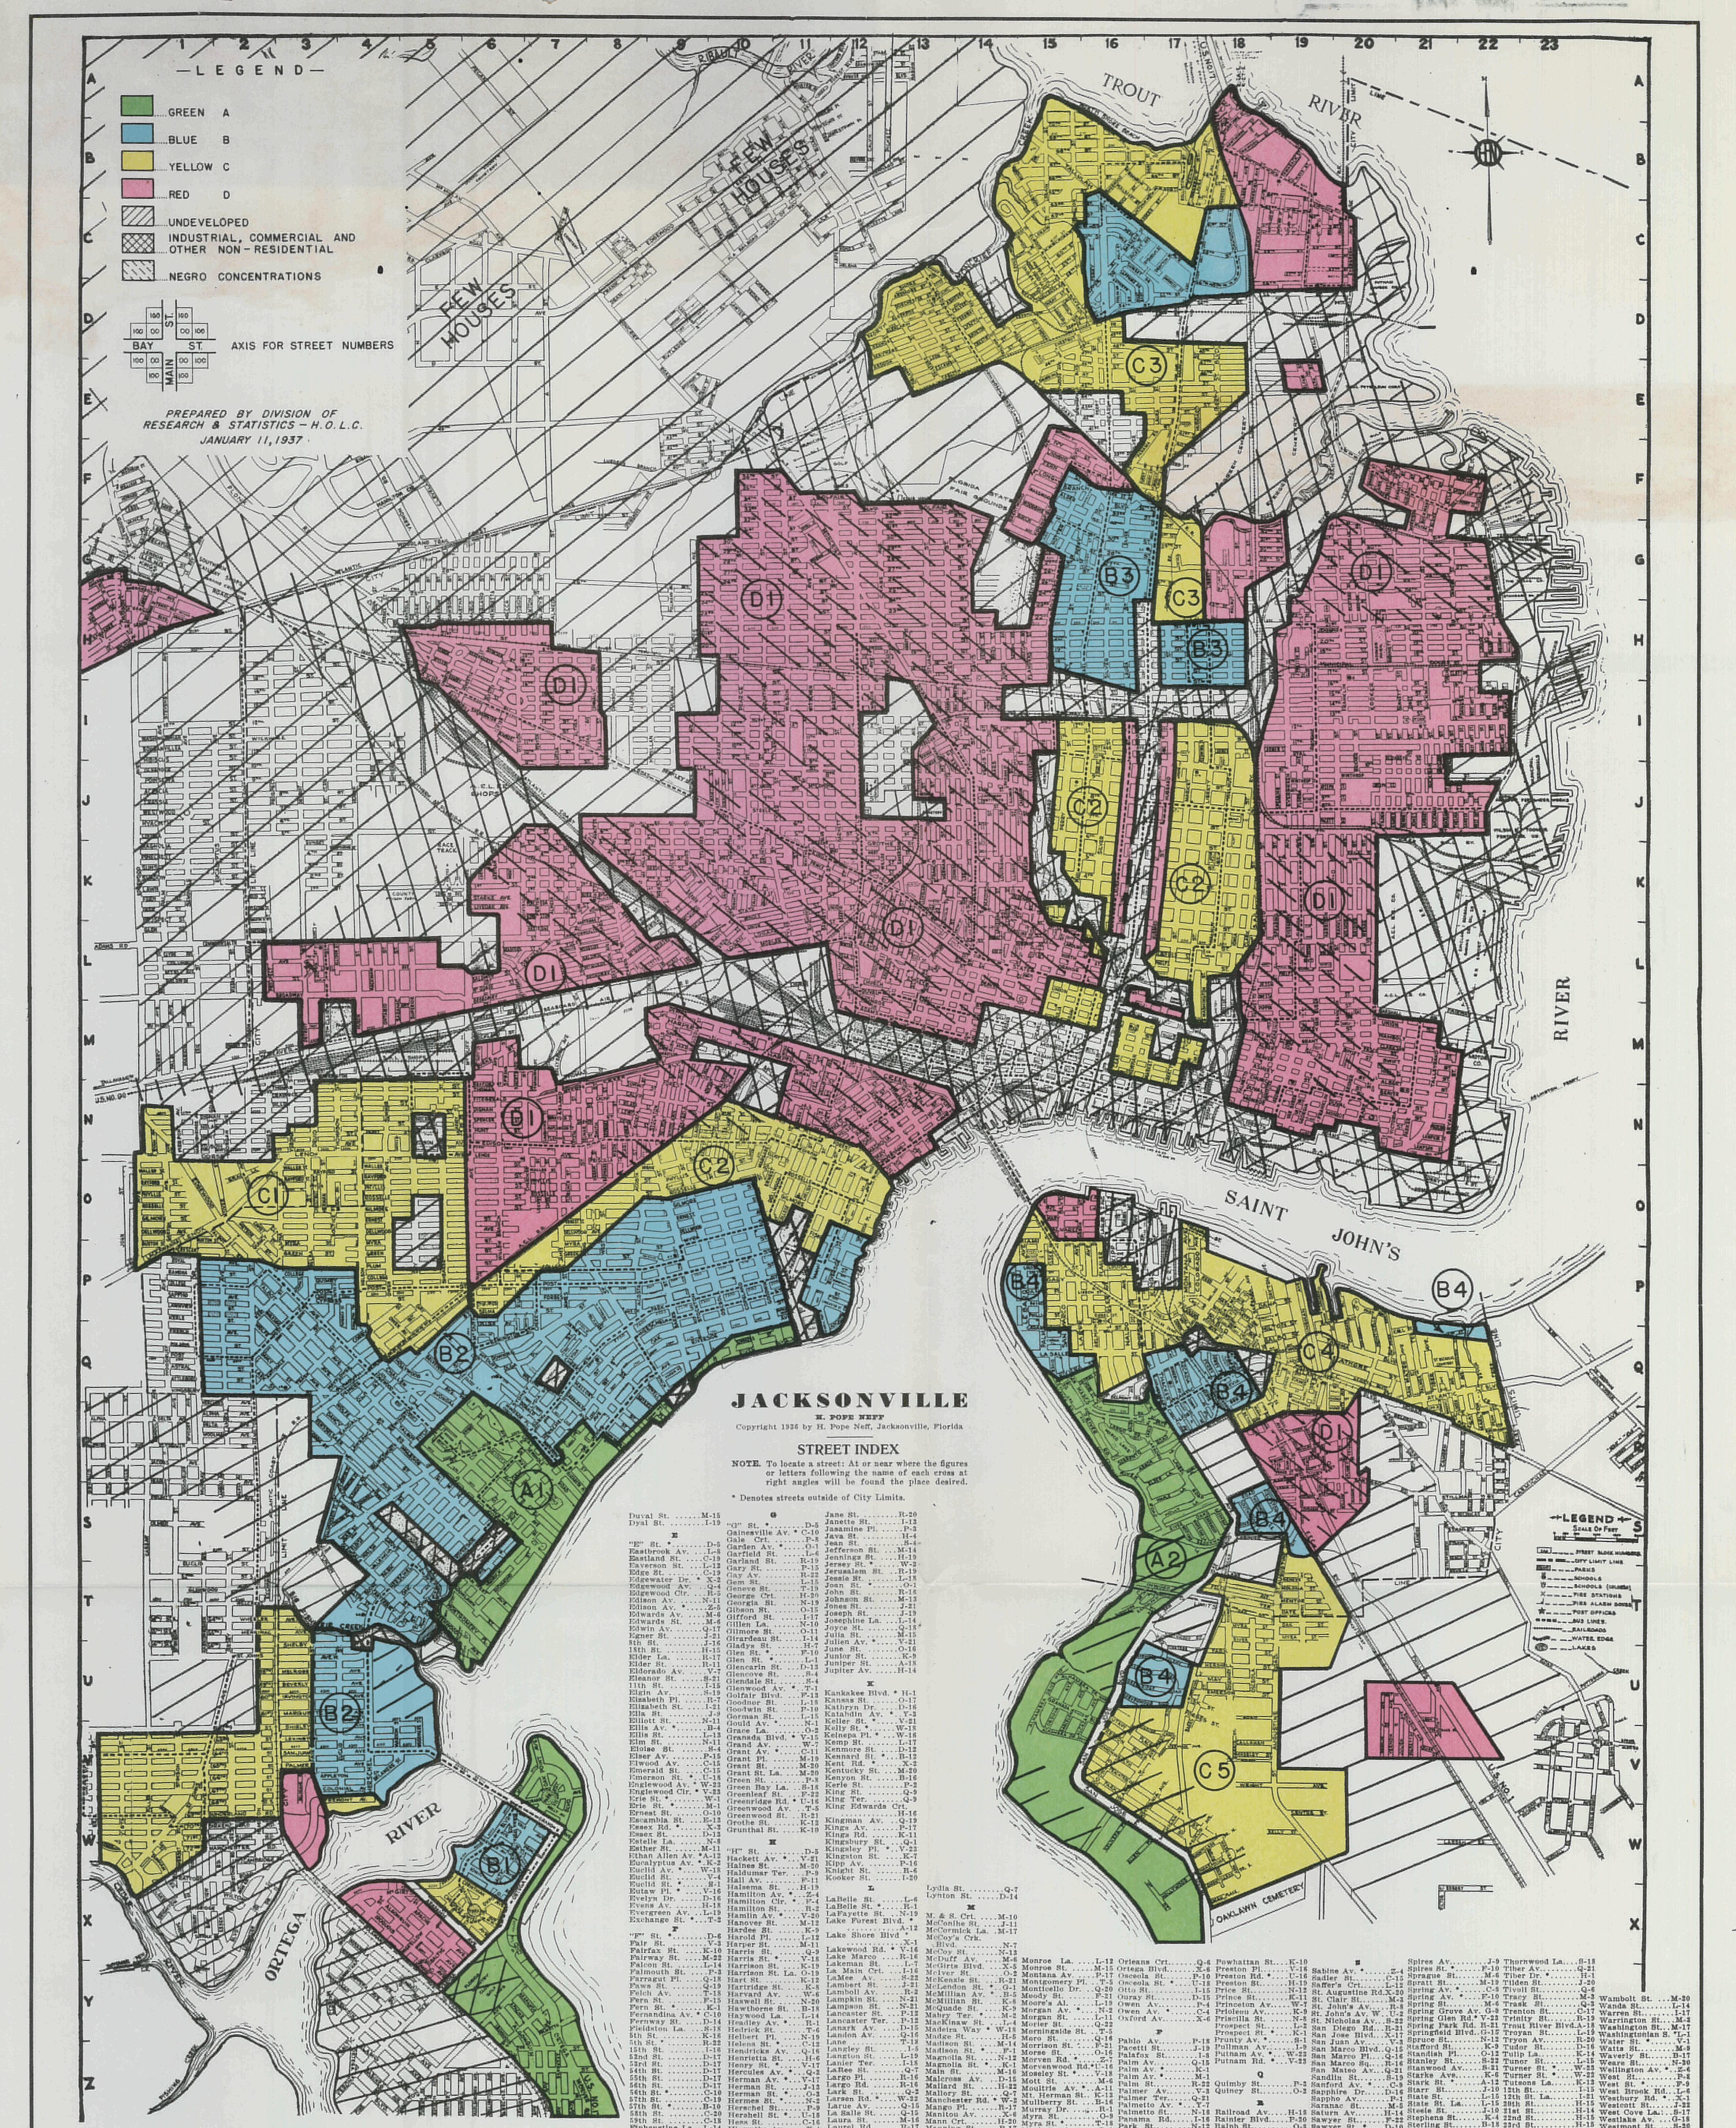
The Home Ownership Loan Corporation (HOLC) created “redline” maps in 1937, which segmented neighborhoods based on a perceived risk in lending. These maps guided lenders in making decisions about where and to whom to provide financing and essentially served as the birth of redlining. When these maps were created, racial segregation in housing was already being explicitly enforced through racially restrictive housing covenants, which made designating predominantly African American neighborhoods in the city as “D” or “Hazardous” a relatively simple exercise.
For example, the first sentence of a description provided for the D-1 zone stated, “This section contains all of the areas of the Realty Area map which are classified as hazardous and embraces principally the negro areas of the city… it is occupied 100% by negroes, except in the outlying portions where whites are intermingled to the extent of about 25%.”


While Jacksonville may no longer be legally segregated due to the passage of the Fair Housing Act of 1968 outlawing racial segregation in housing, areas in the urban core historically occupied by either black or white residents continue to be largely inhabited by those same groups today. During the past 80 years, there have been dramatic changes in population in some of these areas, but when averaged together into the former HOLC segmentation, there is a clear correlation between historic HOLC designations and current racial demographics.
This explicitly illustrates that groups targeted by the racialized lending policies of the past continue to be impacted by those policies’ ramifications to this day.
Income
In addition to racial considerations, HOLC segmentation also addressed economic class and provided an average range of incomes for each A, B, C and D zone. We analyzed the median incomes for each zone and adjusted for inflation to 2020 dollars. While these numbers are not perfectly comparable to today’s median income statistics, the degree of disparity is staggering (see Figure 3 below). On average, residents in zone A generated approximately five times the income of zone B and zone D experienced extreme poverty, making about 2.5% the income as residents in zone A.


When we look at the 2020 income demographics, the overall disparity between HOLC zones is no longer as great as in 1937, but there is still a clear and consistent correlation between a neighborhood’s former HOLC designation and its current median household income (see Figure 4 below).


The impact is evident: formerly redlined areas of Jacksonville still comprise the lowest income and most socially vulnerable sections of the city. It should come as no surprise then that these communities have been able to make significantly little economic progress compared to other sections of the city.
Poverty and Unemployment
The historical and current income disparities across HOLC zones is clear, and other economic indicators, such as poverty and unemployment, illustrate the same trends.
In 2020, formerly redlined communities suffered from a 12% unemployment rate. We should point out that it is unclear the degree to which this data reflects the significant economic impacts of the COVID-19 pandemic compared to normal trends. However, it does show that these same communities suffer disproportionately during any national economic crisis, namely the Great Depression when redlining was created. A 1937 HOLC description described it bluntly: “Negros have been the greatest sufferers during the depression, chiefly because they were laid off first and will be the last to be reemployed as business conditions improve.”
With high unemployment and very low median incomes, redlined communities have suffered some of the highest poverty rates in Jacksonville. On average, formerly redlined areas have more than 35% of households living below the poverty line. This is more than three times the rate seen in the city’s zone A, more than twice the rate of the zone B averages, and even 40% more than zone C neighborhood averages (see Figure 7 below).

Upon examination of these demographics, it is evident that Jacksonville’s most challenged and under-resourced communities today are precisely those that were expressly excluded from economic programs meant to help Americans become more financially sound nearly 100 years ago. These same communities are precisely the ones that LISC Jacksonville is working to uplift and change the future generational trajectory of these neighborhoods.
For those who would like to understand LISC Jacksonville’s methodology for analyzing the information contained in this article, click here. Stay tuned next month for our next article on redlining where we will explore home values and ownership.
To learn more about the communities in which LISC Jacksonville operates, click here.
View the Redline map below: